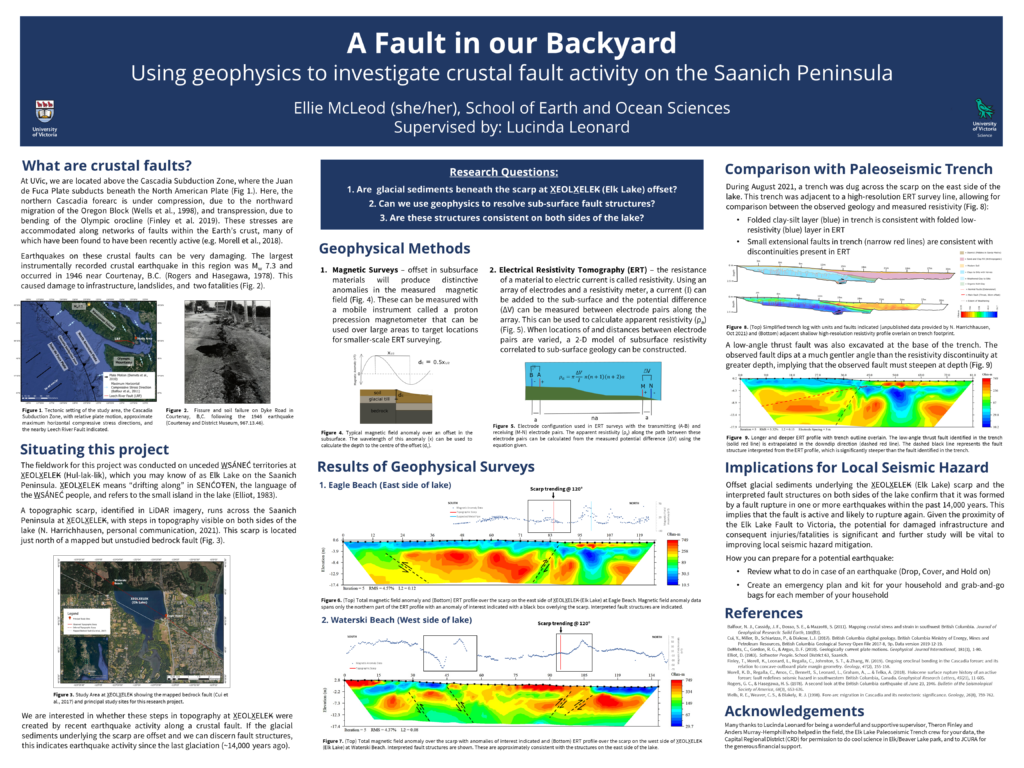
In the past, I’ve used PowerPoint in a variety of ways. The most common way I’ve used it is to make presentations, but I’ve also used it to make academic posters and figures. Something I like about PowerPoint is that you can change the size of a slide, which lets you make a poster of any size. I used this feature to make a poster for a research project in my undergrad (below). I also really appreciate how user-friendly PowerPoint is. Compared to other programs I’ve tried, I find that the learning curve required to make simple graphics in PowerPoint is much less steep than programs like Adobe Illustrator or Inkscape. If you’ve used PowerPoint to make a presentation it’s only a small step further to try graphics or posters.
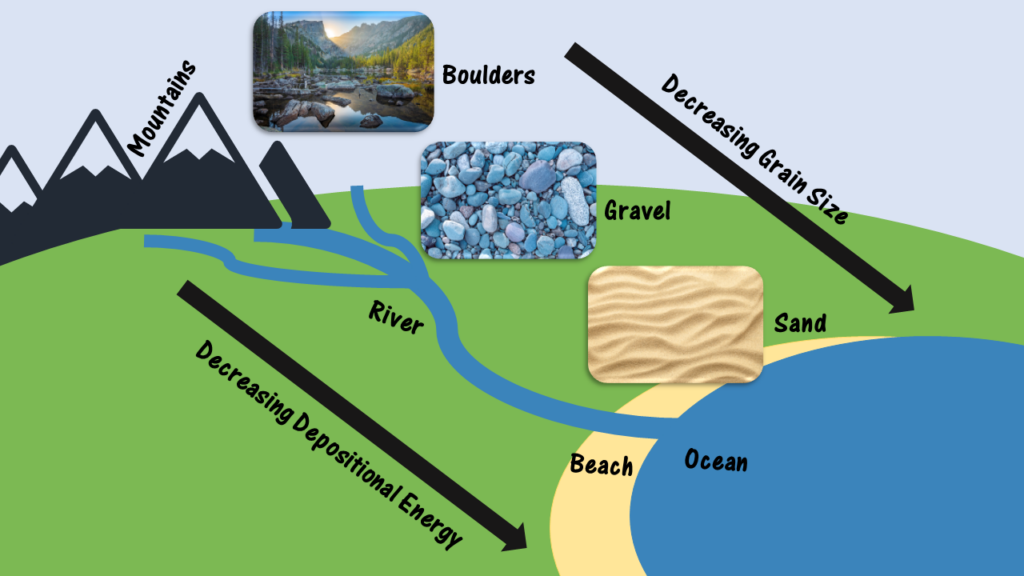
In class, we were introduced to the power of PowerPoint to make simple graphics. Having used it for similar projects in the past, I felt like I had a decent background using PowerPoint going into this, but I learned a bunch of new things! It was awesome! I had no idea that you could use PowerPoint to remove the background of an image. I had also never tried using PowerPoint Icons or 3D models. This class was a great opportunity to play around with a familiar tool in new ways. I ended up trying to make a diagram illustrating how sediment deposition varies downstream following a river from mountains to the ocean. While making the diagram, I tried to use some tools that were new to me, like icons. This diagram is relevant to Physical Geography 12 or Geology 12. Knowing how the energy of an environment impacts sediment deposition underpins interpretation of the history of a sedimentary rock. Creating a diagram in PowerPoint could be one way to test student’s knowledge of a topic like this in a creative way.
Leave a Reply
You must be logged in to post a comment.